
Business forecasts that also say how sure they are
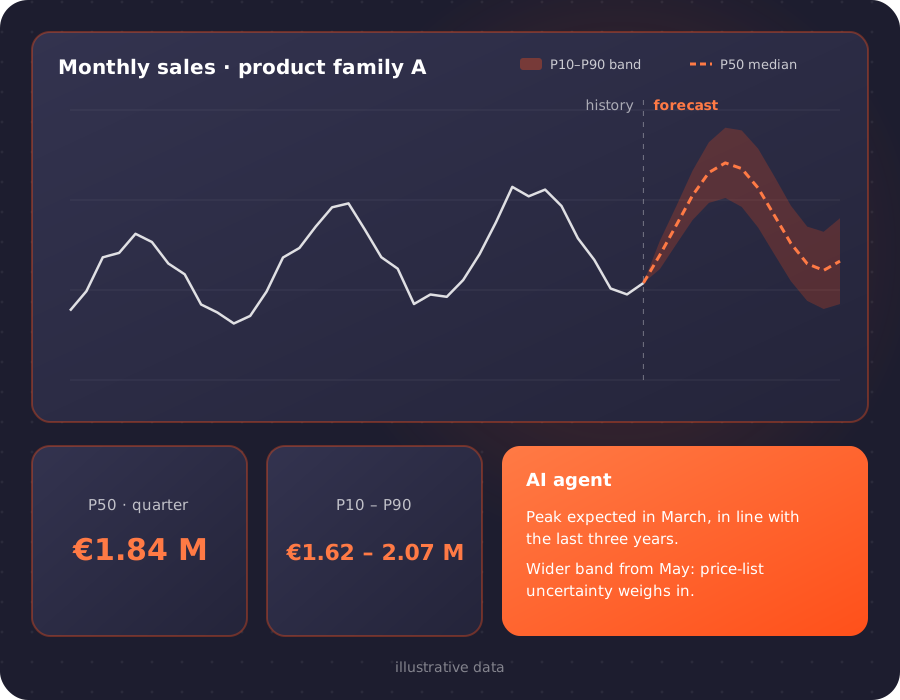
Sales, costs, raw-material prices, cash: a time-series foundation model forecasts them together, taking price lists, promotions and the calendar into account, and returns a probability band instead of a single number. An AI agent explains it in plain language.
The principle: a model that has already seen millions of series
Classic forecasting builds one model per series and retunes it by hand whenever something changes. A time-series foundation model is pretrained on a wide variety of historical series: it recognises seasonality, trends and breaks even on a series it has never seen, and works on dozens of related series in a single pass.
Many series, together
Sales by family, costs by item, prices by raw material: series that influence each other are forecast jointly, not one at a time.
A band, not a number
Every forecast comes with percentiles: the median and the plausible range. The cautious budget and the optimistic one come out of the same forecast.
Explained in plain language
An LLM agent reads the forecast, the history and the assumptions, and writes what is driving the result and where uncertainty grows.
What can be forecast
Any quantity the company records over time, with at least a few cycles of history behind it.
Sales and demand
By family, customer, channel or region, with promotions, price lists and the calendar as covariates known in advance.
Costs and budgets
Cost items, monthly actuals, budget variances: the quarterly review starts from a band, not from last year's spreadsheet.
Raw materials
Price trends for metals, polymers, energy and gas, together with the exchange rates and indices that move with them, to decide when to hedge.
Collections and cash
Expected receipts and payments week by week, with the low band as the reference for cash requirements.
Inventory and reordering
Item consumption and safety stock computed from the upper percentile instead of a fixed rule.
Energy and production
Plant consumption and output volumes, read from the same field systems used for monitoring.
How it is built
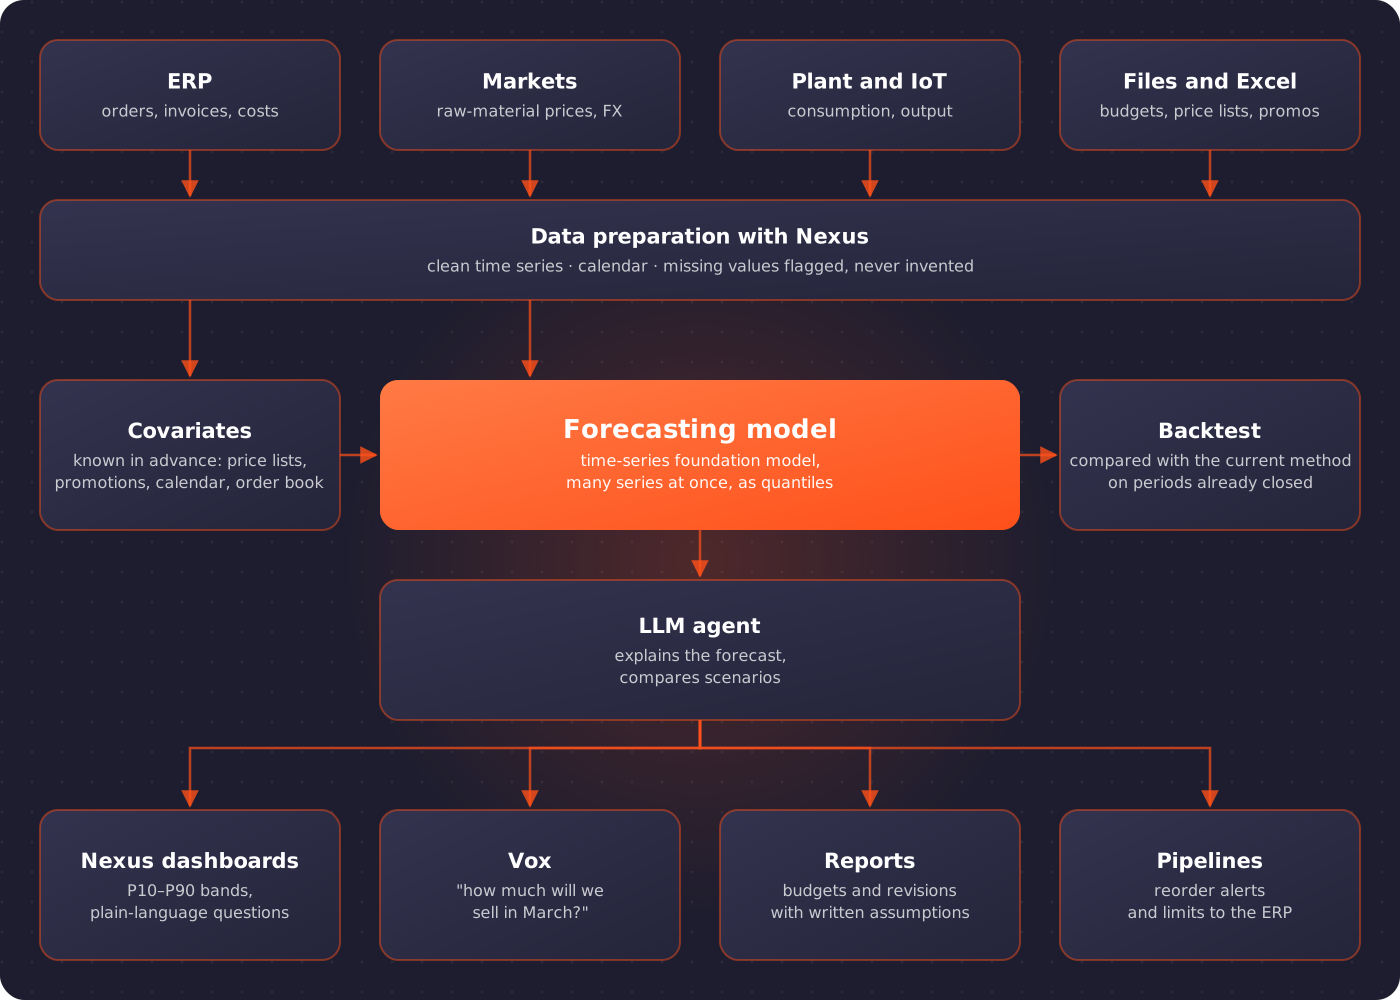
Data comes from the systems already in place, Nexus prepares it, the model forecasts, the backtest checks, the LLM agent explains. Forecasts end up where people work.
Why the band matters more than the number
A point forecast is almost always wrong: the useful question is by how much. With percentiles every department uses the part of the forecast it needs.
The cautious case
For treasury and for commitments that cannot be cancelled: how much cash is reasonably certain.
The central value
For the budget and production planning: the most likely estimate.
The high case
For safety stock, capacity and raw-material purchasing: how much may be needed if things go better or prices rise.
The information the model uses
Besides the history, the model accepts covariates: data that helps explain the series.
Known in advance
Price lists already decided, planned promotions, working calendar and holidays, order book, scheduled plant shutdowns.
Past only
Price indices, exchange rates, related raw-material prices, website traffic or requests for quotation: they help read the history even when their future is unknown.
Categories
Product family, region, channel, customer type: the model learns from series that are similar to each other.
How it is adopted
First we show the forecast beats the current one on periods already closed; then it goes into production.
Data inventory
Which series, at what frequency, how much history, which covariates really exist. Missing data is flagged, never invented.
Backtest
Past months are forecast again and compared with the method used today, Excel included, and with a simple seasonal forecast.
Pilot
One or two families of series, with an error metric and a success threshold agreed before we start.
Integration
Nexus dashboards with the bands, spoken questions through Vox, budget revision reports, pipeline alerts to the ERP.
Monitoring
Real error is measured at every close; when a series gets worse the cause is investigated before the model is touched.
What it does not do
A forecasting model extends the behaviour it finds in the data. A war, a tariff, a supplier going under or a new competitor are not in the history: in those cases the band widens, but it does not anticipate the event. This matters even more for raw materials: the forecast is a scenario with its uncertainty, to be used alongside the buyer's judgement, not instead of it.
Data stays in the company
The forecasting model is compact and runs on CPU or GPU on your own servers, next to Nexus and the AiDream suite's LLM. Sales, costs and margins never leave the company perimeter.
What it builds on
Forecasting uses the data and channels already in the AiDream suite.
Frequently asked questions
Is it an LLM like ChatGPT?
The model that forecasts is a time-series foundation model: it uses the same transformer architecture as LLMs, but it is trained on sequences of numbers instead of text. The suite's LLM works next to it to explain the forecasts and answer questions in plain language.
How much history is needed?
The model is pretrained and works on short series too, but recognising a yearly seasonality takes at least two or three years of monthly data, or a few months of daily data. The backtest tells straight away whether the history is enough.
Does a model have to be trained for every series?
No. The model forecasts new series without specific training, which is what makes forecasting hundreds of items or cost lines practical. Where it pays off, it can be fine-tuned on the company's data.
Can raw-material prices be forecast?
Their trend can be forecast with its uncertainty, using the history of prices and related indices. Market shocks cannot: that is why the forecast is read as a band and updated with every new data point.
Does it work with our Excel files?
Yes. Budgets, price lists and promotion plans in Excel come in as series or covariates; Nexus joins them with ERP data and the forecast goes back to Excel or into a report.
Shall we put your forecasts to the test?
We start with a backtest on one of your series, sales, costs or a raw material, and compare it with the method you use today.
Let's talk